Image-to-3D Pilot20 · End-to-End, Shape, and Texture
TRELLIS.2-4B vs Hunyuan3D-2.1 vs S3-T50 · 2026-08-13
image-to-3dbenchmarkToys4Kpilot20
TL;DR
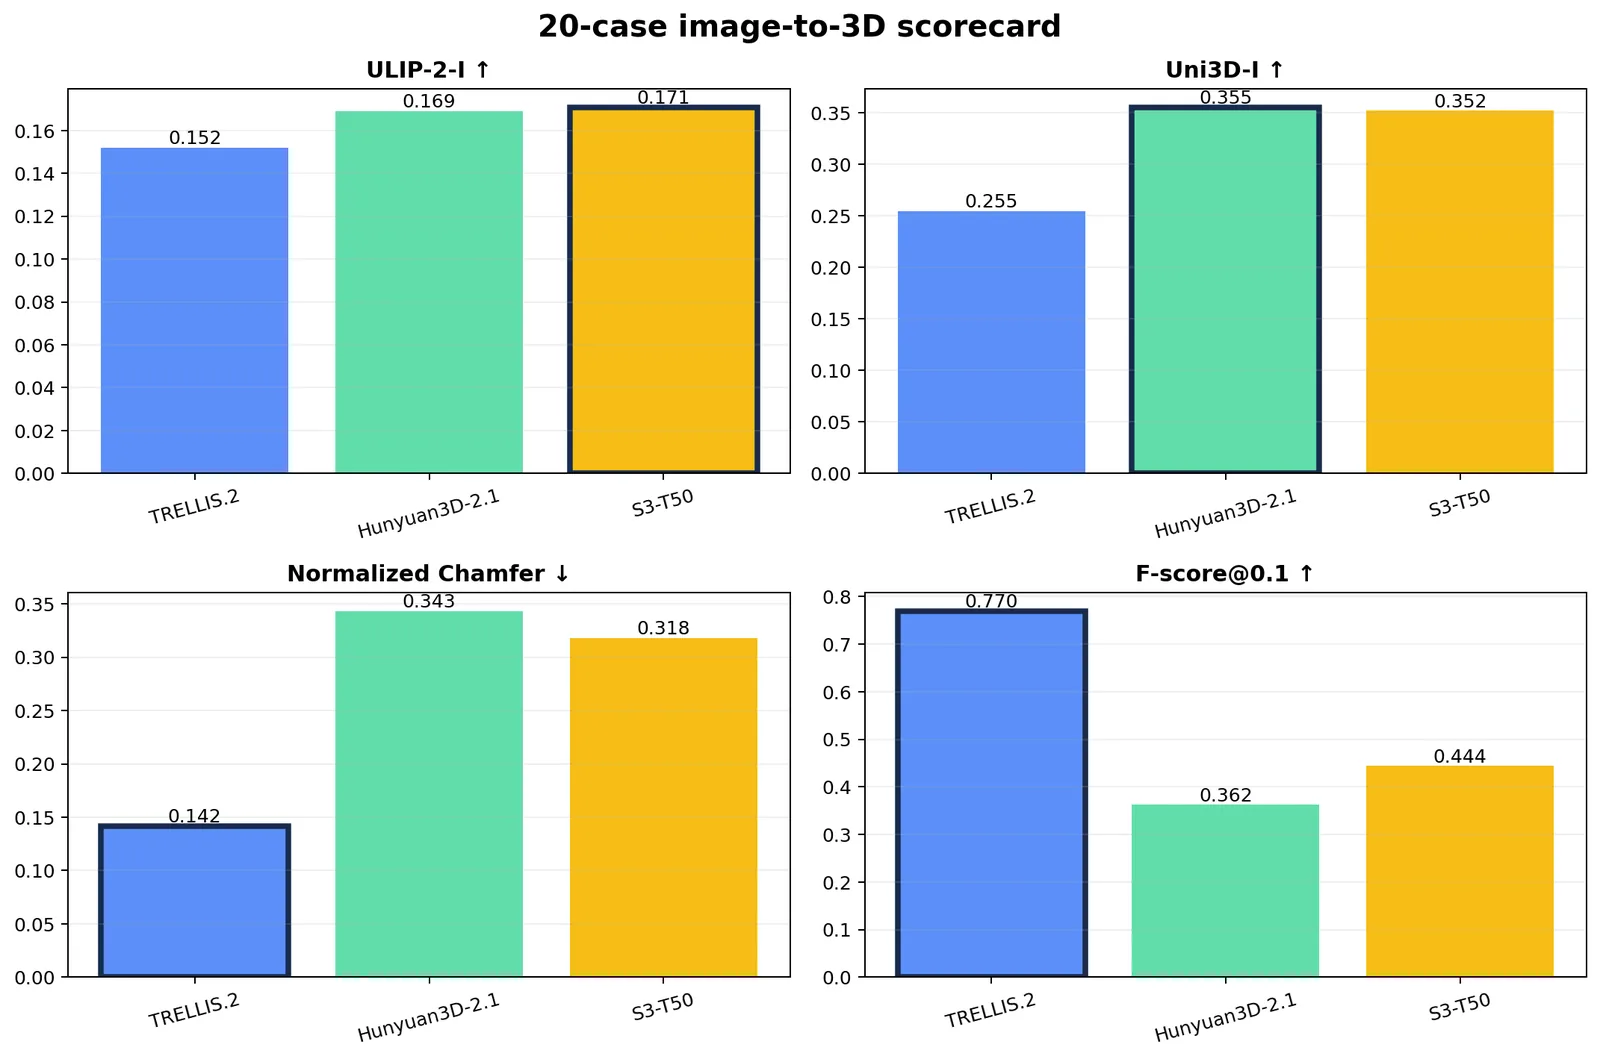
S3-T50 matches Hunyuan on image-to-geometry alignment and beats it on both released X-Ray shape metrics.
TRELLIS.2 remains the clear geometry leader: CD 0.142 and F-score 0.770.
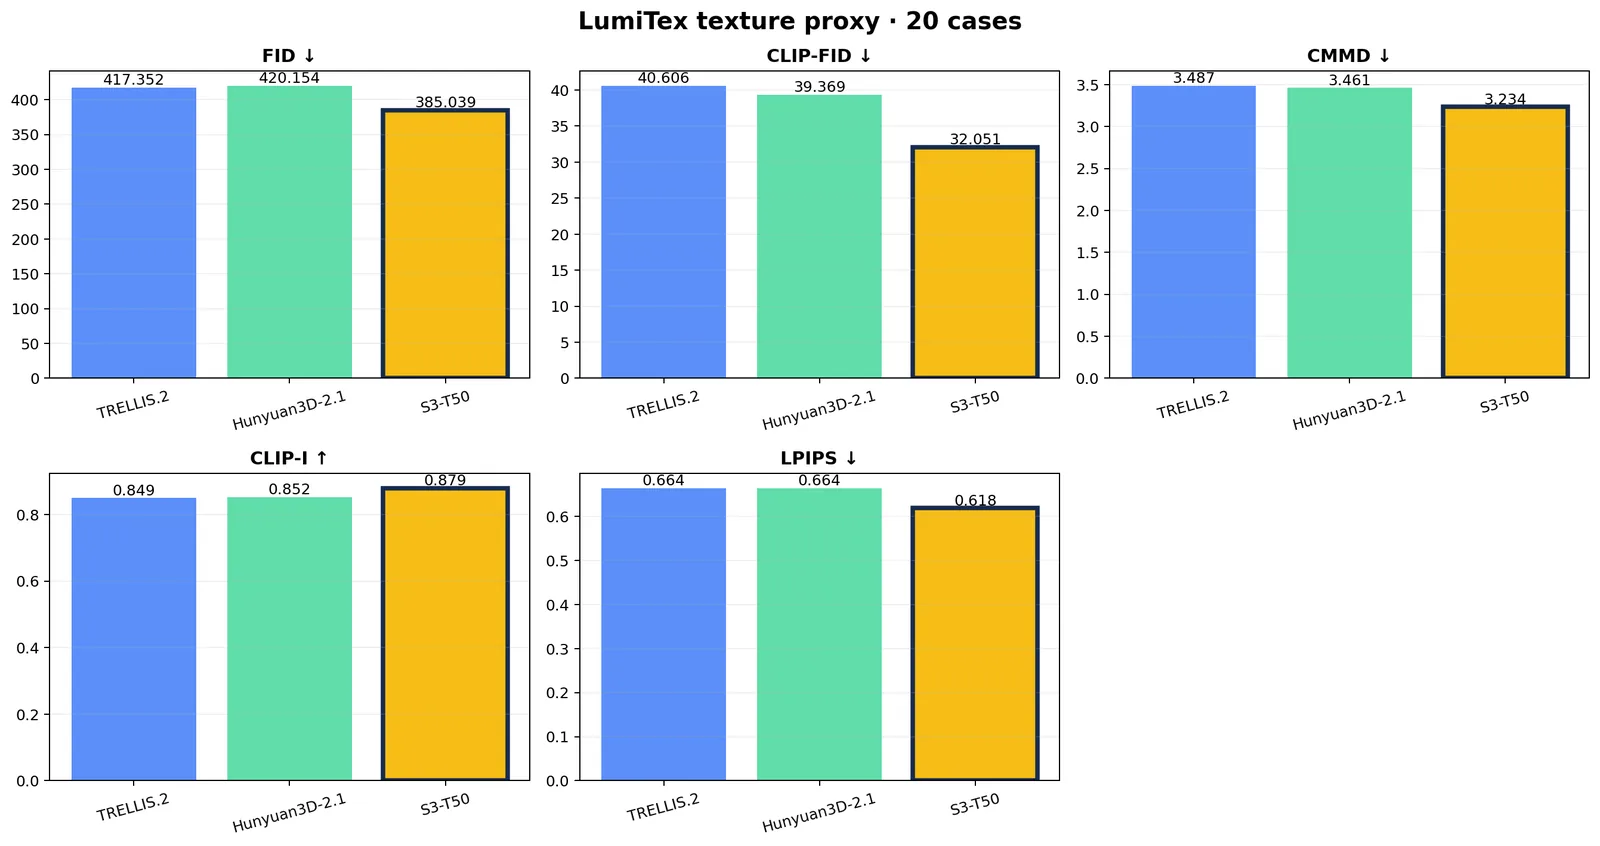
S3 leads all five texture-proxy metrics, but the GT latent reconstruction shares its SC-VAE decoder; this is diagnostic, not a paper-equivalent texture claim.
1 · One frozen set, three independent scorecards
20 deterministic single-view Toys4K cases: one asset from each of 20 categories.
All three models receive the exact same released TRELLIS.2 512 px condition renders and seed 0.
No cross-track overall score: semantic alignment, geometry, and appearance answer different questions.
Official scorer code is frozen; local adapters only map file layouts and persist results.
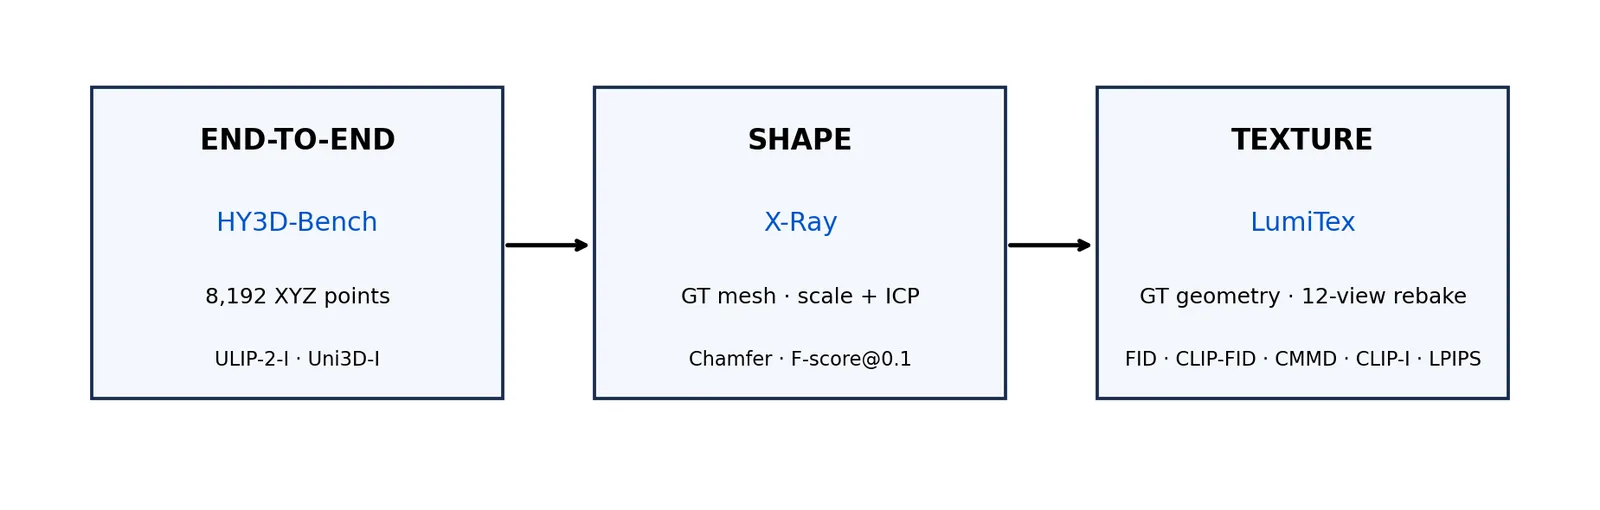
Three released evaluator families keep semantic alignment, GT geometry fidelity, and GT-geometry texture fidelity separate.
2 · End-to-end semantic alignment · HY3D-Bench
Released protocol: normalize each mesh, sample 300K surface points, farthest-point-sample 8,192 XYZ points.
ULIP-2-I and Uni3D-I compare geometry embeddings with the conditioning image; materials are not consumed.
S3 and Hunyuan are effectively tied across the two encoders; TRELLIS.2 trails on this pilot.
Model
N
ULIP-2-I ↑
Uni3D-I ↑
TRELLIS.2-4B
20
0.1519
0.2546
Hunyuan3D-2.1
20
0.1690
0.3555
S3-T50
20
0.1708
0.3520
S3 edges Hunyuan on ULIP-2-I; Hunyuan edges S3 on Uni3D-I; TRELLIS.2 dominates both GT-shape metrics.
3 · Shape fidelity · X-Ray normalized evaluation
Released X-Ray alignment: mean-absolute scale matching followed by point-to-point ICP.
Released metrics: bidirectional Chamfer distance and F-score at threshold 0.1.
S3 improves over Hunyuan by 7.4% in CD and 22.6% in F-score; TRELLIS.2 remains far ahead.
All 20 per-case values are retained because category variance is substantial.
Model
N
Chamfer ↓
F-score ↑
TRELLIS.2-4B
20
0.1418
0.7696
Hunyuan3D-2.1
20
0.3434
0.3623
S3-T50
20
0.3181
0.4440
4 · Texture isolation · LumiTex metric stack
Proxy GT: decoded Toys4K shape/PBR latents. The original PBR .blend assets and LumiTex 133-case test set are unavailable.
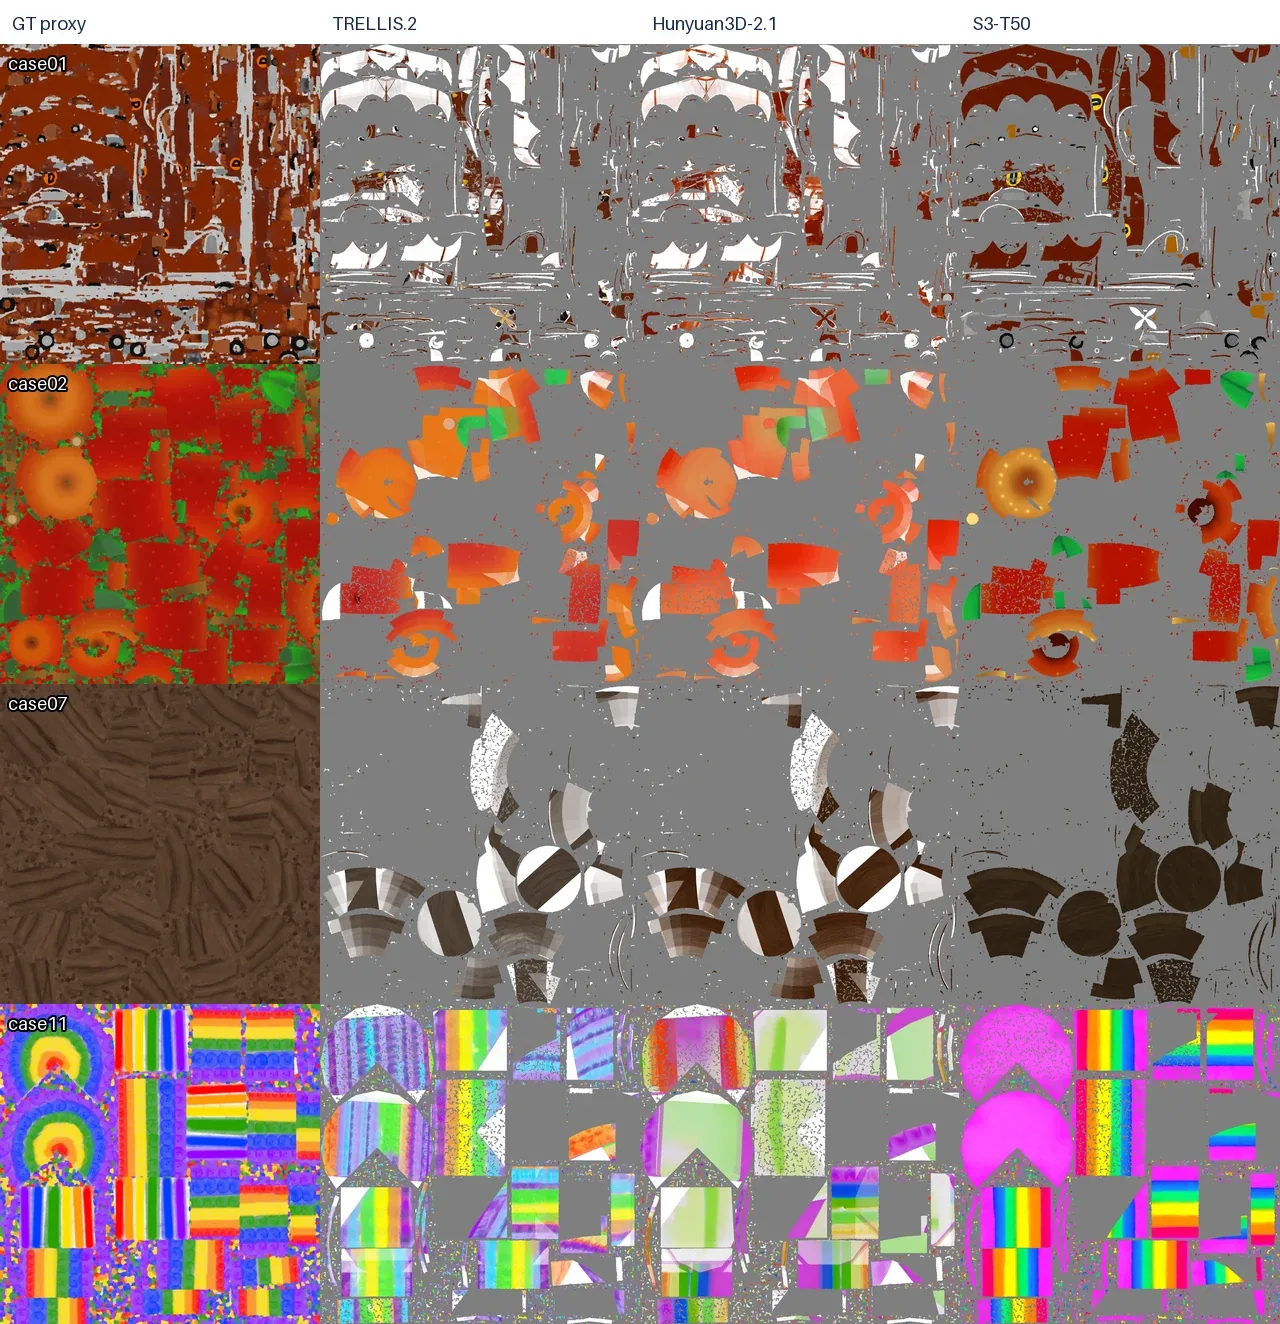
Each method textures the same GT geometry; LumiTex renders 12 fixed views and rebakes them onto the standard mesh.
Released metrics run unchanged: FID, CLIP-FID, CMMD, CLIP-I, and LPIPS.
The released evaluator measures base color only; metallic, roughness, and normal maps are not scored.
S3 leads all five proxy metrics, but decoder sharing can advantage it; do not compare these values with paper tables.
Model
N
FID ↓
CLIP-FID ↓
CMMD ↓
CLIP-I ↑
LPIPS ↓
TRELLIS.2-4B
20
417.35
40.61
3.487
0.8494
0.6640
Hunyuan3D-2.1
20
420.15
39.37
3.461
0.8522
0.6640
S3-T50
20
385.04
32.05
3.234
0.8794
0.6184
S3 wins every metric against the decoded-latent proxy; the direction is consistent but the magnitude is not paper-comparable.LumiTex's standard-mesh UV rebake exposes appearance differences on four representative cases.
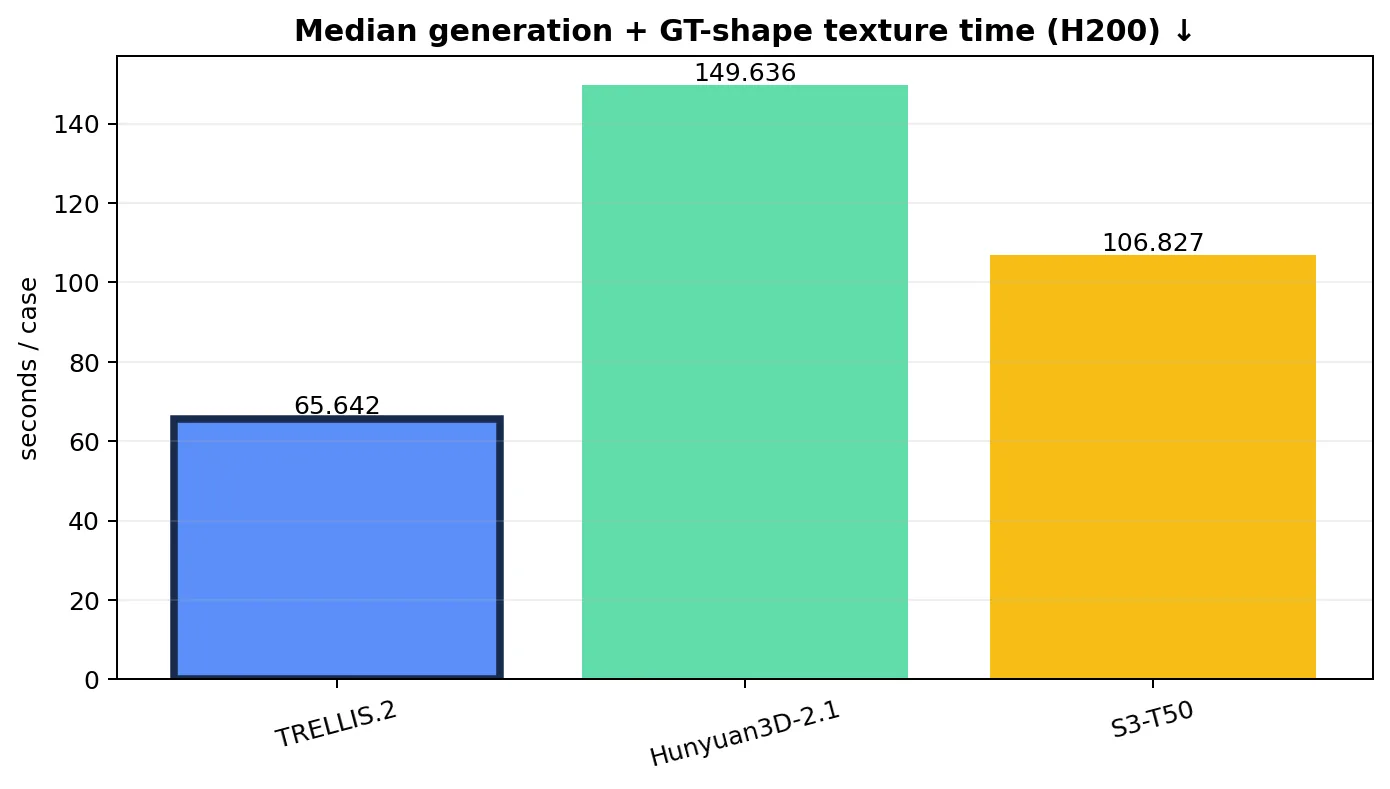
5 · Runtime and frozen provenance
Model
Median s/case
Estimated warm 20-case time
Implementation
TRELLIS.2-4B
65.6
21.9 min
microsoft/TRELLIS.2 @ 2ed033d
Hunyuan3D-2.1
149.6
49.9 min
Tencent-Hunyuan/Hunyuan3D-2.1 @ 82920d
S3-T50
106.8
35.6 min
SS-11K / shape-17K / texture-17K
Median times exclude one-time cold model loading and include full asset generation plus the separate GT-shape texture pass on one H200.